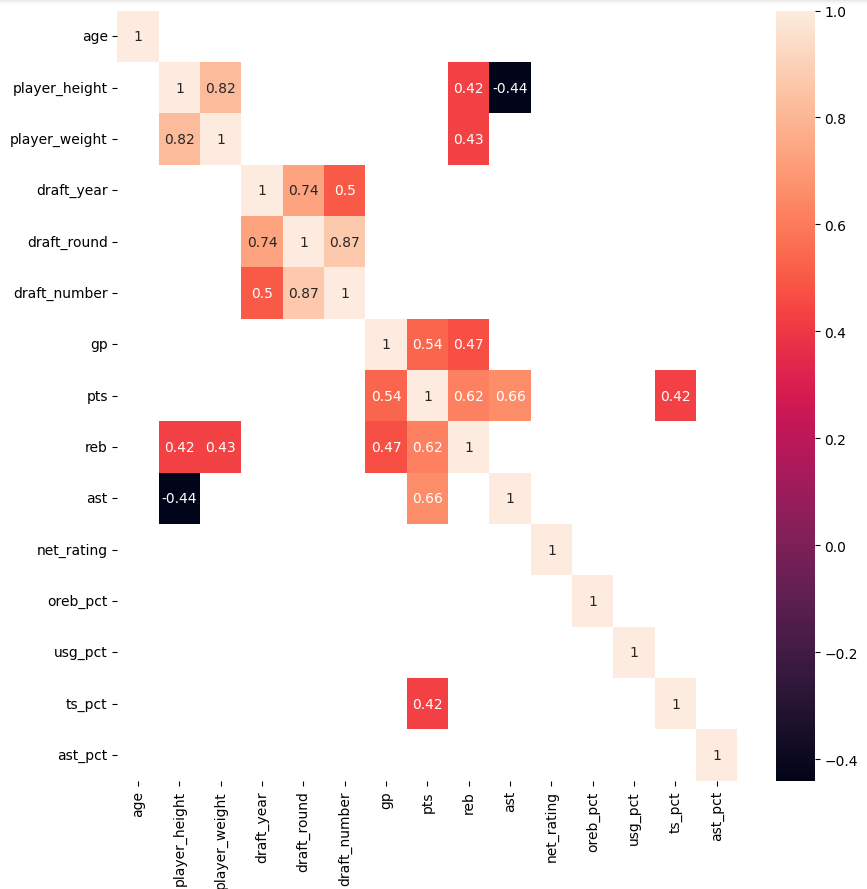
Insights: 1. reb has a moderate positive correlation to player_height (Taller and heavier players get more rebounds) 2. player_height and ast are negatively correlated (Shorter players tend to have higher assist percentages, which makes sense, since guards will mostly be handling the ball) 3. pts, reb and ast are positively correlated (There is a higher likelihood that players who can score also can dish the `ball to their teammates. Nikola Jokic or other players that can score triple doubles)

The average height of NBA players appears to have experienced a decline, potentially influenced by the strategic shift towards small-ball line ups, featured by the Golden State Warriors during their renowned 73-9 season. This shift could be attributed to the importance on three-point shooting in today's game, leading teams to prioritize players with sharpshooting skills over traditional big men..
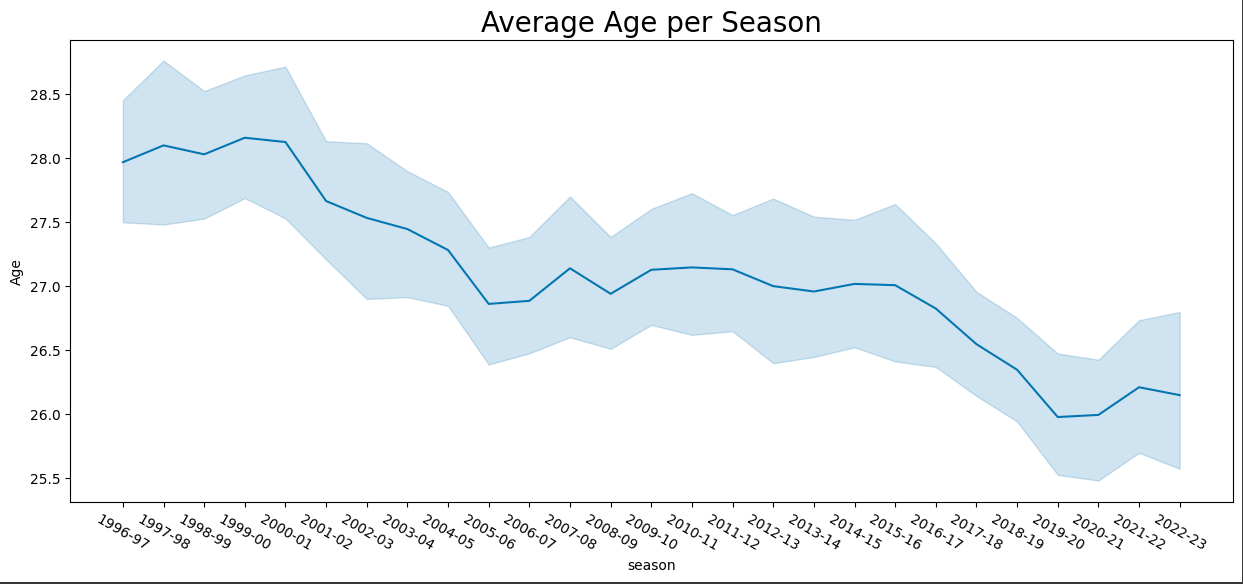
Fascinatingly, the average age of NBA teams has witnessed a nearly 2-year decrease in the last 25 years. This suggests a growing inclination among teams to heavily invest in their younger players. The youth is the future, and it seems like the future is here to stay.
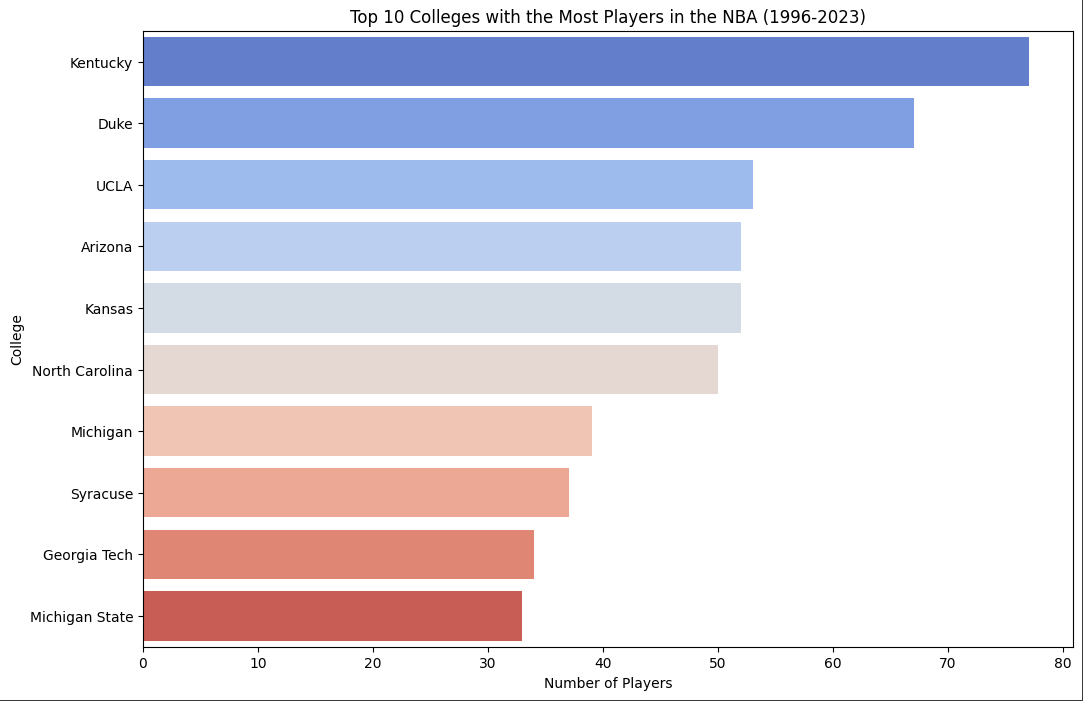
In this first graph, well-known, dominant basketball programs like Duke and Kentucky lead the list, which is expected given their storied histories and large numbers of high-caliber players. These programs have a long tradition of excellence in college basketball and have been successful in sending a significant number of players to the NBA, underscoring their status as powerhouse institutions for budding professional athletes.
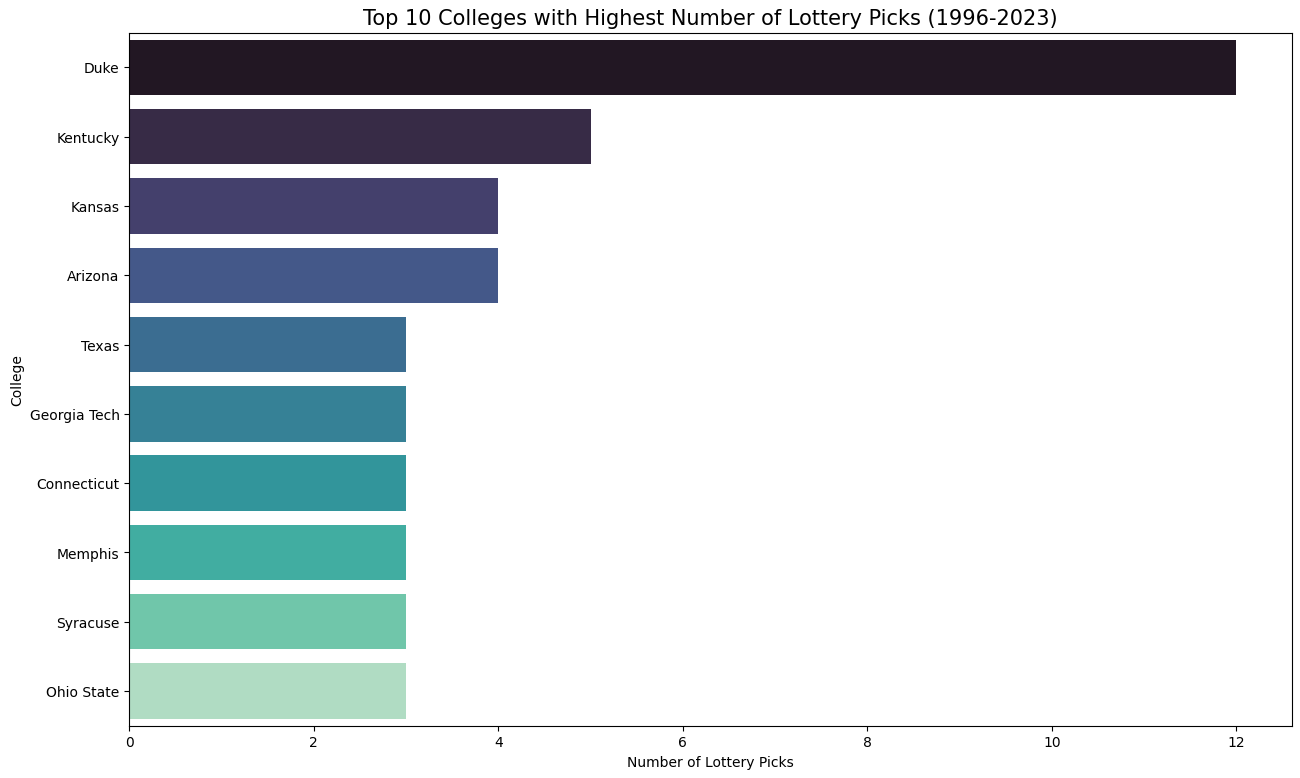
This graph continues to highlight the dominance of programs such as Duke and Kentucky, showcasing the sheer volume of lottery picks they have produced. This reflects not just the ability to attract elite high school talent, but also the capability of these colleges to maintain a consistent level of performance and visibility that places their players in the spotlight for NBA drafts.
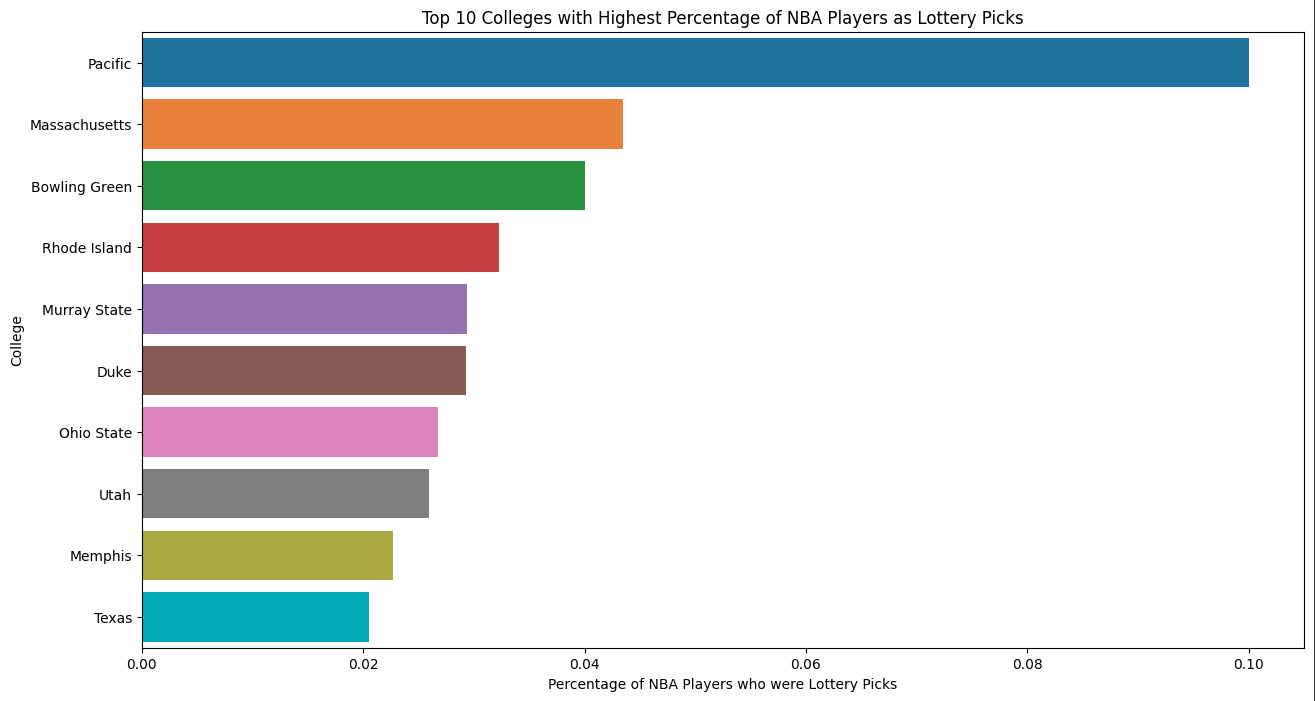
This final graph features some less prominent programs like Pacific and Bowling Green, suggesting that while they may not produce as many NBA players overall, a higher percentage of those who do make it are selected as lottery picks. This could indicate that certain programs are particularly effective at developing their players into top prospects, even if they have fewer players who make it to the NBA. This final graph provides a relative measure that accounts for the size of the program, giving a sense of efficiency or quality over quantity. The discrepancy between this final graph and the former two might suggest that more prominent programs are better at recruiting already talented players who are likely to become lottery picks, while the less prominent programs might be better at talent development. This final graph shows a diversity of programs contributing to the NBA's top draft picks, challenging the perception that only the "blue blood" basketball schools are the main paths to NBA success.
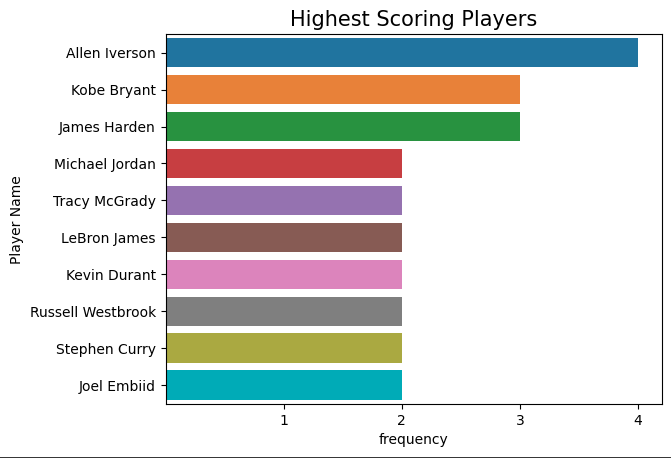
Right away, notable names such as Allen Iversen emerge as a dominant force, leading the league's scoring charts in four distinct seasons. Kobe Bryant and James Harden closely follows with three seasons topping the scoring sheet. Yet, this visualization focuses solely on the foremost scoring leaders, overlooking numerous outstanding scoring performances by other players throughout the years simply because they didn't clinch the top spot. What if we aimed to identify the top 10 scorers each season? That would paint an entirely different picture!
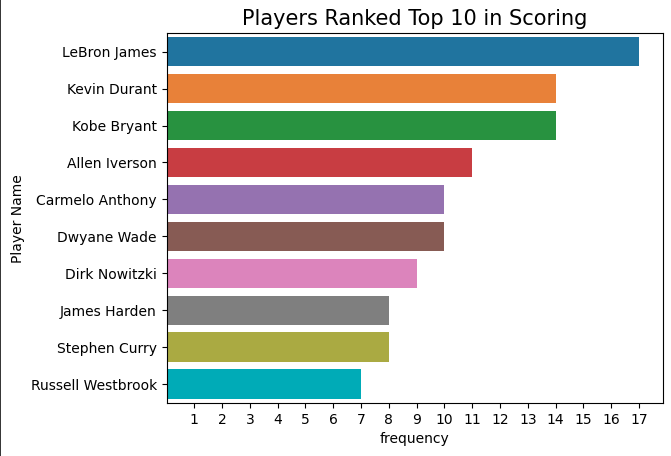
Lebron, Kobe and Durant now lead the pack, placing in the top 10 in scoring for 17 and 14 seasons respectively.
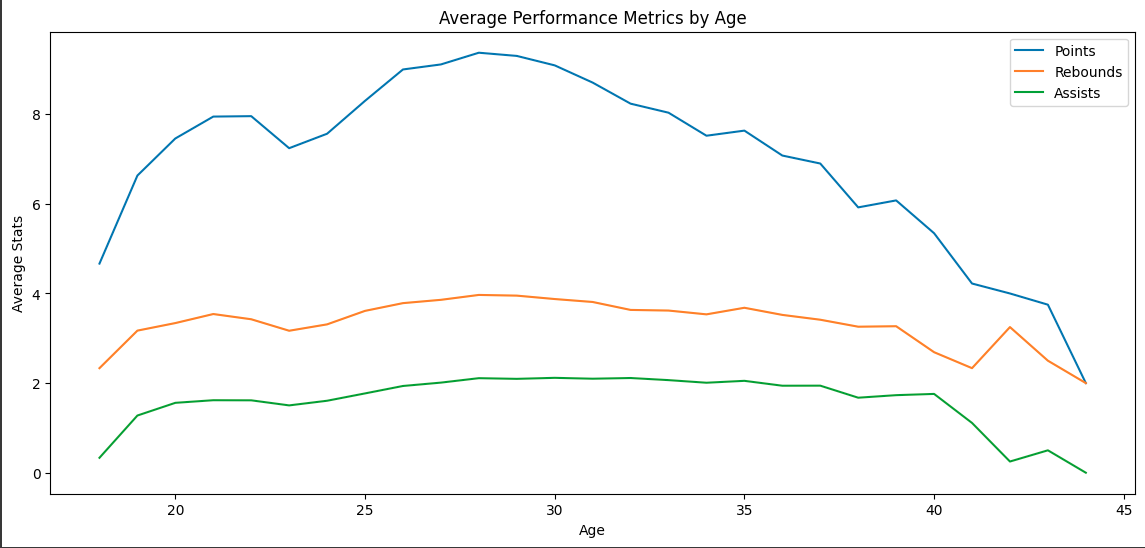
This graph provides insights into the typical peaks of a basketball player's career. Scoring tends to reach its height early, which might be attributed to the energy and athleticism of younger players. Rebounding appears less affected by age, hinting at the role of positioning and technique. Assists increase with age, suggesting that players develop a better sense of team dynamics and game management as they mature.
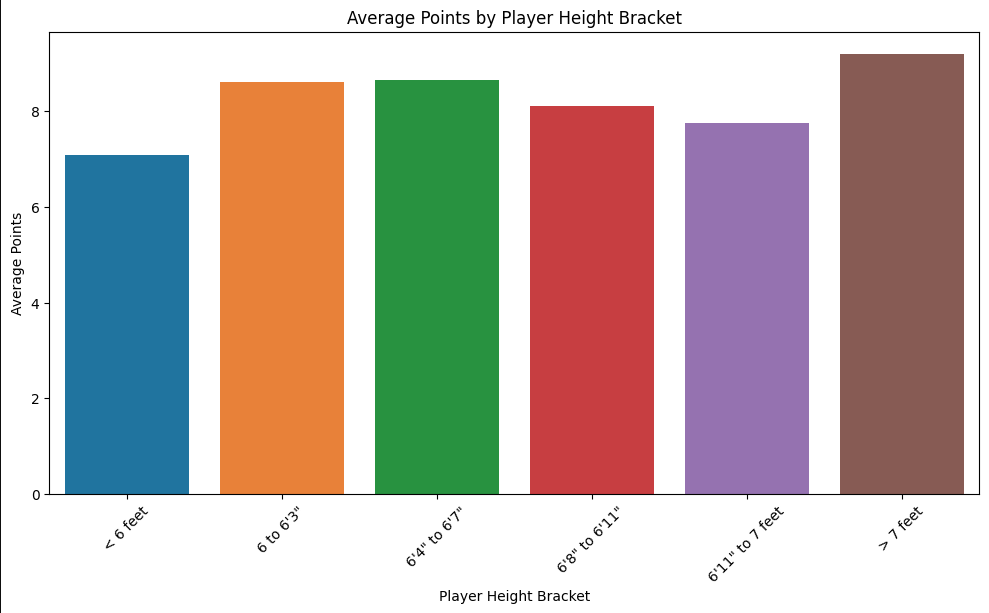
Height appears to give players a scoring edge, as shown in this bar graph. Taller players generally score more, likely due to their ability to shoot over defenders and their proximity to the basket. However, the presence of points across all height brackets indicates that height is just one of many factors that contribute to a player's scoring ability.
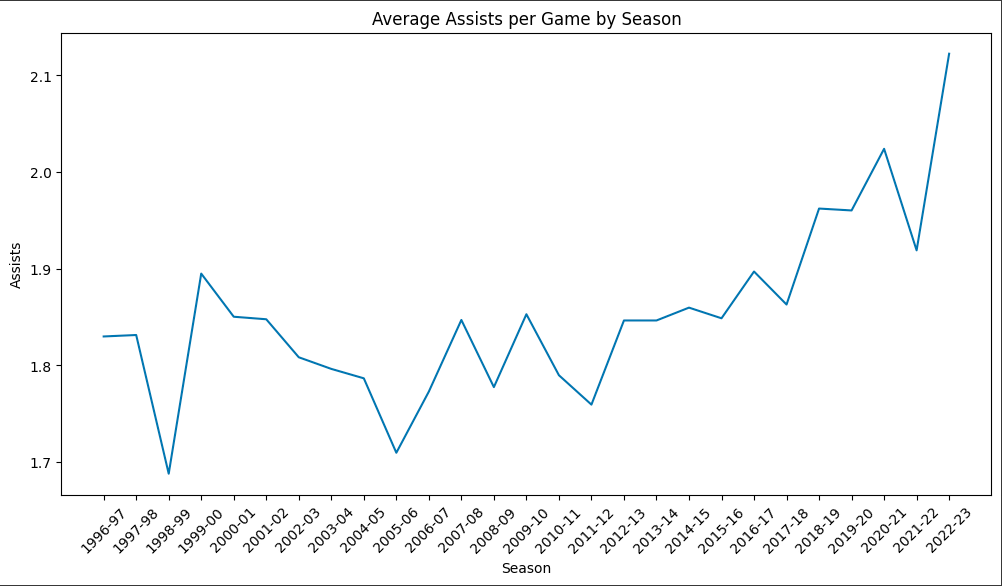
The increase in assists over the seasons depicted in this graph may reflect a shift towards more team-centric play. The steep rise in recent seasons suggests that the game is evolving, with a stronger emphasis on ball movement and playmaking to create scoring opportunities.
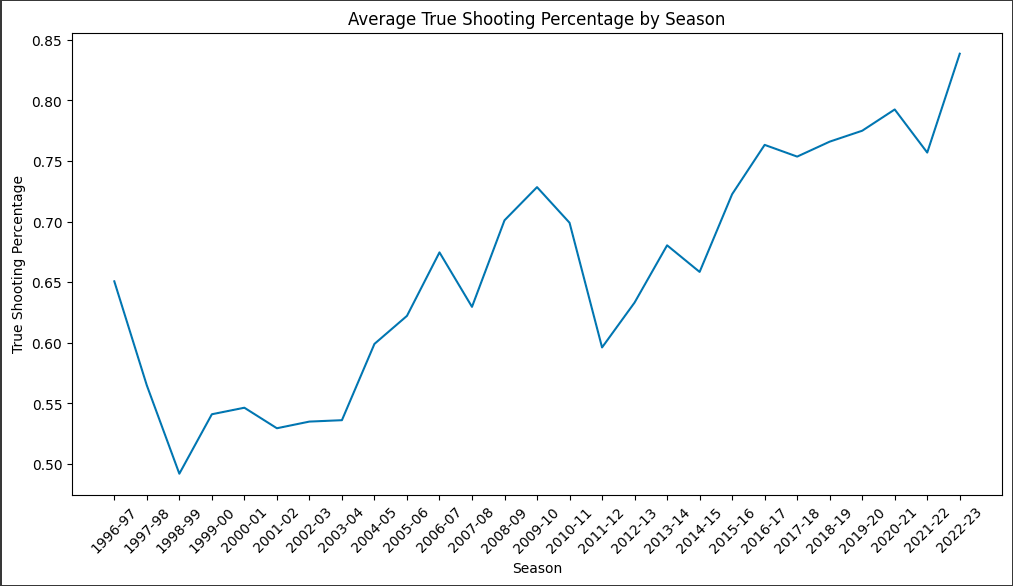
This graph traces the upward trend in shooting efficiency over several basketball seasons. Notably, players today are more accurate than ever, a change that likely reflects advancements in training, player selection, and the strategic emphasis on high-efficiency shots. Despite some fluctuations, the general increase suggests that players and coaches have grown more adept at maximizing scoring opportunities.
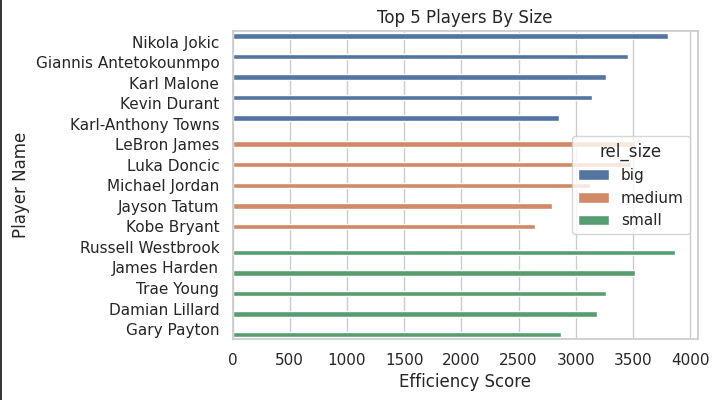
This ranking was conducted by taking into consideration the various advantages athletes of differing physical attributes have. The weighting scheme is applied to NBA players by categorizing them based on relative size. The smaller third of players are awarded higher points for grabbing rebounds, the middle third are awarded slightly higher points for having assists and rebounds, and the largest third of players are awared higher points for having assists.